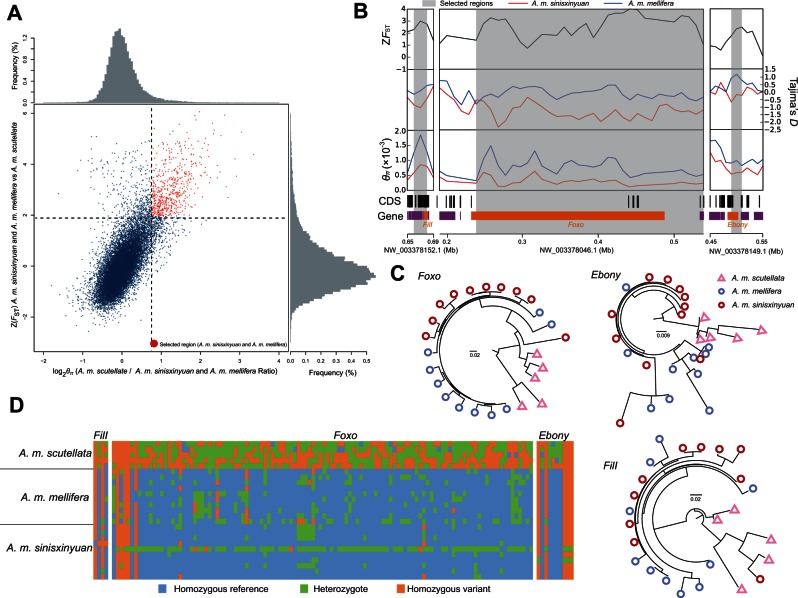
Fig. 3.
Genomic regions with strong selective sweeps in Apis mellifera sinisxinyuan and A. m. mellifera. (A) Distribution of θπ ratios (θπ, A. m. sinisxinyuan and A, m. mellifera/θπ, A. m. scutellata) and FST values, calculated in 20-kb windows sliding in 10-kb steps. Data points on the right of the vertical dashed line (corresponding to the 5% left tail of the empirical θπ ratio distribution), and above the horizontal dashed line (5% right tail of the empirical FST distribution) were identified as selected regions for A. m. sinisxinyuan and A. m. mellifera (red points). (B) Examples of genes with strong selective sweep signals in A. m. sinisxinyuan and A. m. mellifera. FST, θπ, and Tajima’s D values are plotted using a 10-kb sliding window. Shaded genomic regions were the regions with strong selective signals for A. m. sinisxinyuan and A. m. mellifera. Genome annotations are shown at the bottom (black bar, coding sequences; purple bar, genes). The boundaries of FilI, Foxo, and Ebony are marked in orange. (C) The gene trees for FilI, Foxo, and Ebony for A. m. sinisxinyuan, A. m. mellifera, and A. m. scutellata. (D) Genotypes of SNPs in putative selective sweeps containing FilI, Foxo, and Ebony in A. m. sinisxinyuan, A. m. mellifera, and A. m. scutellata.

