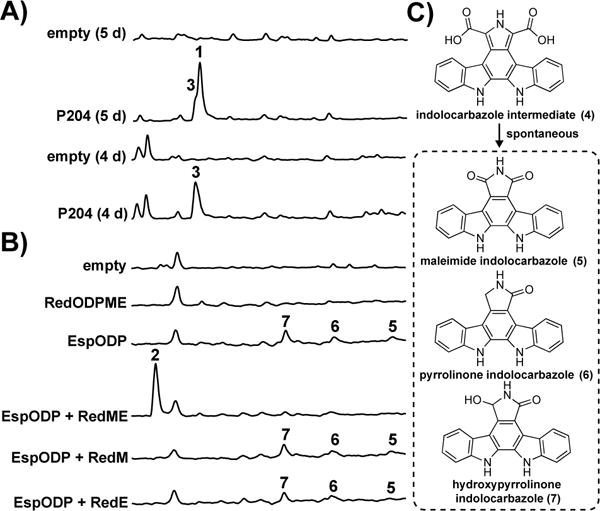
Figure 3. HPLC-UV chromatograms of bacterial extracts in heterologous expression studies.

A) hys cluster in S. albus. B) red cluster in E. coli. C) Low levels of 5, 6, and 7 present in select broth extracts that are produced by spontaneous decarboxylation of 4.
