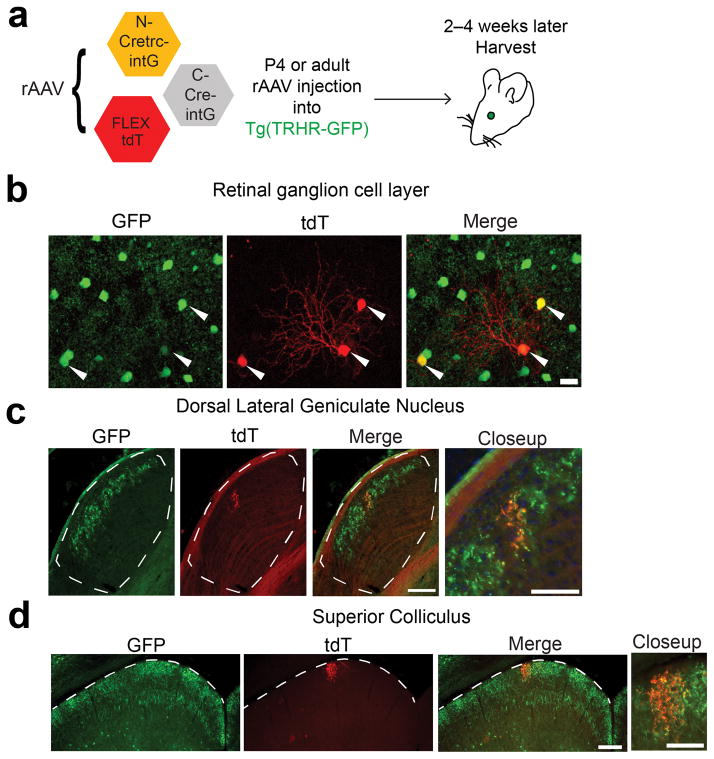
Figure 3. rAAV delivery of CRE-DOGOPT to retinas of a GFP line.
(a) Schematic of viral injection into the retina. (b) Expression of tdT in GFP+ retinal ganglion cells (RGCs). Arrows indicate tdT-positive cells. Scale bar, 20 μm. Images representative of 4 retinas. (c–d) Tracing of tdT+ RGC projections into the dorsal lateral geniculate nucleus (c) and superior colliculus (d). White dotted lines delineate boundary of the aforementioned visual pathway region. tdT fluorescence was boosted by immunostaining. Scale bar, 100 μm in whole region view, 50 μm in closeup view. Images representative of 3 brains.

