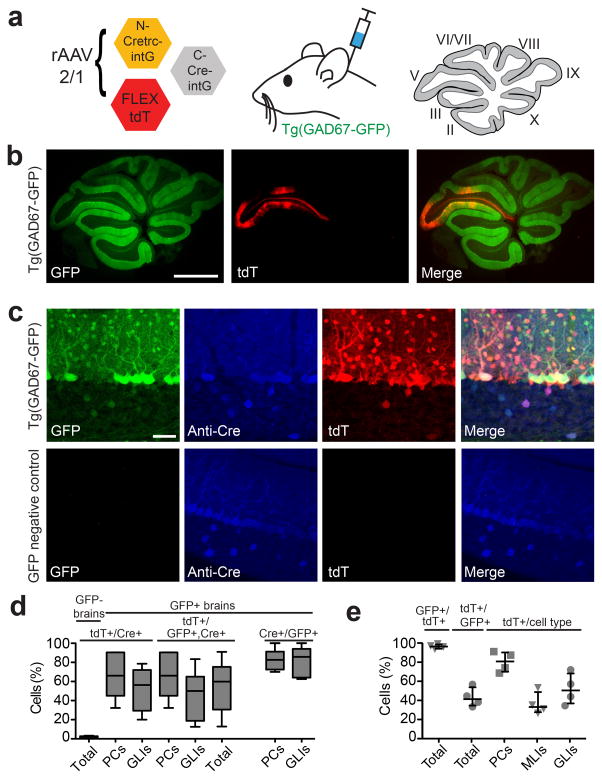
Figure 6. rAAV delivery of CRE-DOGOPT to the cerebellum of a GFP line.
(a) Left: Schematic of viral injection into mouse cerebellum. rAAV-2/1 viruses were injected into lobule V and brains were harvested 3 weeks post-injection. Right: sagittal section of the cerebellar vermis with lobules labeled. (b) Sagittal section of Tg(GAD67-GFP)+ cerebellum (green) showing tdT (red) induction in injected lobule. Scale bar, 1 mm. (c) CRE-DOGOPT induces tdT expression in Tg(GAD67-GFP) (top), but not GFP-negative (bottom) cerebellar cortex. Panels show GFP (green), anti-Cre immunostaining (blue) and tdT (red) expression. Scale bar, 50 μm. (d–e) Quantification of infection outcome. Plots show percentage of cells positive for a marker, given the presence of additional marker(s) (1st marker/2nd, 3rd marker). (d) Quantification of tdT+ cells that are also GFP+ and/or Cre+. Sample size: 516 GFP+, 422 Cre+ and 317 tdT+ cells in 7 sections. (e) Additional quantification of CRE-DOG labeling. Sample size: 845 GFP+ and 368 tdT+ cells in 12 GFP+ sections. 643 Cre+ cells and 6 tdT+ cells were counted in 4 Gad– sections. PCs, Purkinje cells. MLIs, molecular layer interneurons. GLIs, granule layer interneurons. Boxplots indicate minimum to maximum range. All data and images reported are gathered from or representative of 4 Tg(GAD-GFP)+ animals and 3 GFP-negative animals.

