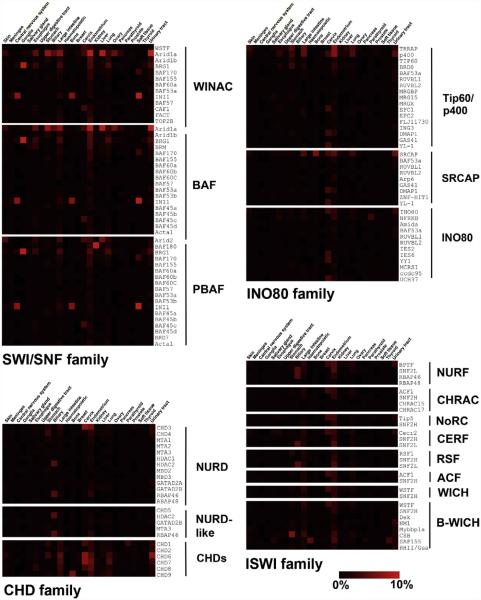
Figure 5.3. Heat map representation of somatic mutation rate for subunits of chromatin remodeling complexes in human cancers.
The COSMIC database was queried using each of the subunits found in the chromatin remodeling complexes depicted in Fig. 5.2 (Forbes et al., 2011). The frequency of somatic mutation is expressed as a percentage of sequenced tumors from each tissue type. Percentages are not corrected for background mutation rates which vary with individual tumors and tumors from tissue types. The heat map range is shown on the lower right and varies from 0% to 10% of sequenced tumors in the COSMIC database.

