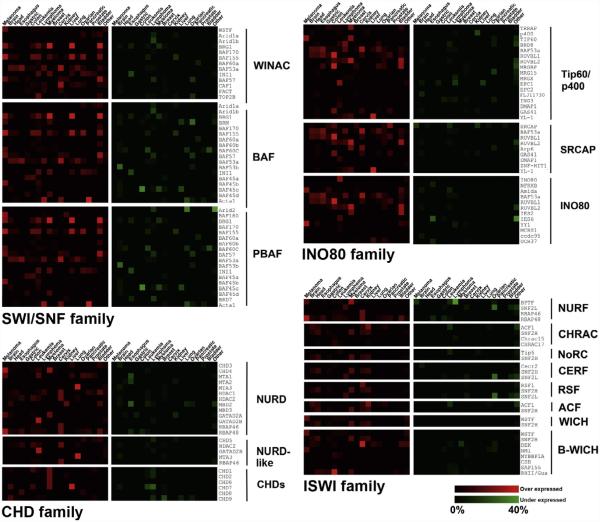
Figure 5.4. Heat map representation of gene expression changes for subunits of chromatin remodeling complexes in human cancers.
The ONCOMINE database was queried using each of the subunits found in the chromatin remodeling complexes depicted in Fig. 5.2 (Rhodes et al., 2004). Data is expressed as a percentage of unique analyses for which transcript levels of the subunit differ by greater than twofold between tumor and control normal tissue (P value≥1.0×10⁻⁴). Transcripts for which overexpression was observed in tumor tissue are colored in red, and those where an underexpression is observed are shown in green. The heat map range is shown on the lower right and varies from 0% to 40% of unique analyses found in the ONCOMINE database.

