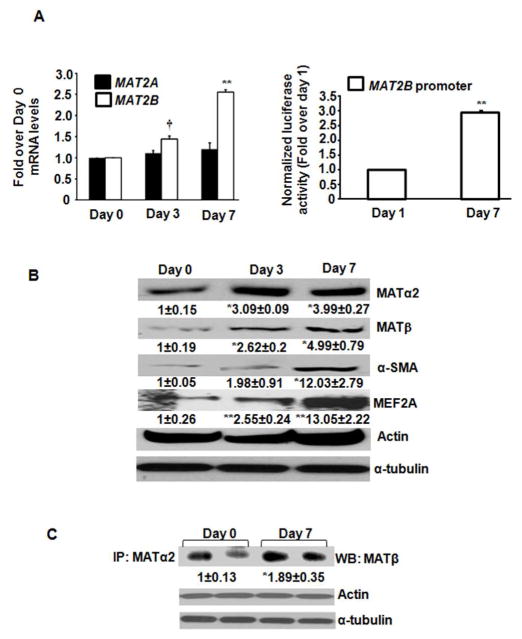
FIGURE 1. MAT2A and MAT2B expression and interaction in primary human HSCs.
A (left panel). Total RNA from day 0, day 3 and day 7 cultured human HSCs was subjected to quantitative RT-PCR for MAT2A and MAT2B as described in Materials and Methods. Results expressed as fold over day 0 are mean ± S.E from three HSC preparations in duplicates. **p<0.005. †<0.001 vs. day 0. A (right panel). Luciferase activity from day 1 or day 7 HSCs transfected with the MAT2B-luc promoter constructs was normalized to that of pGL3-Basic and expressed as fold over day 1 cells. Results represent mean ± S.E. from three experiments. **p<0.005 vs. day 1. B. Total cellular protein from day 0, day 3 and day 7 cells was immunoblotted with MATα2, MATβ, α-SMA, MEF2A, α-tubulin and actin antibodies. Results are densitometric analysis (mean ± S.E.) from four HSC preparations. *p<0.05, **p<0.005 vs. day 0. C. Total protein from day 0 or day 7 HSCs was immunoprecipitated with MATα2 antibody and immunoblotted for MATβ protein. Results are mean ± S.E from four experiments; two representative experiments are shown. *p<0.05 vs. day 0.

