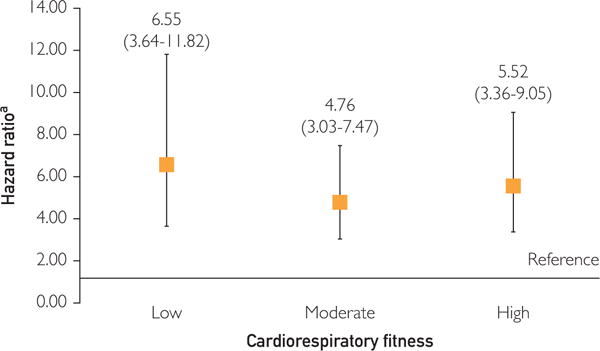
FIGURE 2.

Adjusted hazard ratios (95% CIs) for the relationship between moderate or high 10-year coronary heart disease risk (as classified by the Framingham Risk Score) and coronary heart disease, stratified by low, moderate, and high cardiorespiratory fitness. Low 10-year coronary heart disease risk served as the reference group.
aAdjusted for baseline examination year
