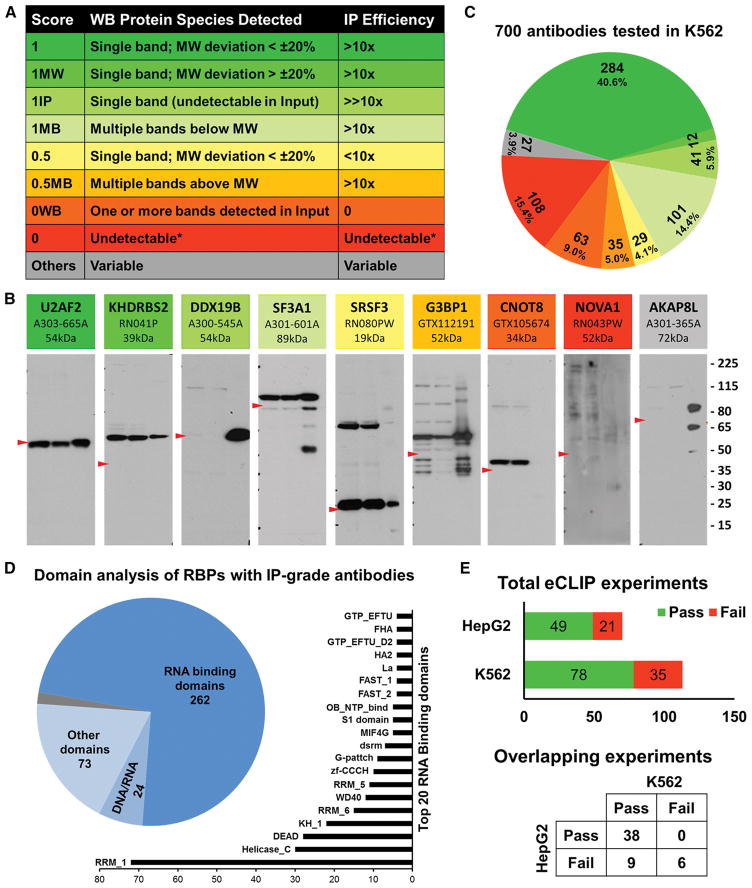
Figure 1. Immunoprecipitation-western blot validation of antibodies against RBPs.
(A) Scoring scheme with rows of matching colors representing antibodies as in panel B. Column 1 is the IP score, column 2 is the description of protein species detected in the WB and column 3 is IP efficiency deduced from the ratio of band intensities of input and IP pull down lanes.
(B) Representative blots of antibodies with distinct IP scores. The shades of colors from green to yellow to red represent high, medium and unacceptable quality of antibodies. Grey antibody represents antibodies with ambiguous IP scores. Each blot contains name of the RBP, catalog number and expected MW at the top. Within each blot, lane 1 is 2.5% of input of K562 whole cell lysate, lane 2 is 2.5% of supernatant after IP and lane 3 is 50% of IP pull down sample. Red arrowhead in each panel points to the expected MW of the RBP and size marker (in kDa) is at the right.
(C) Distribution of IP scores of 700 antibodies validated in K562 cells. Color pattern is consistent with representative antibodies in panel A and score description in panel B.
(D) Domain analysis of 365 unique RBPs that have IP-grade antibodies. Pie chart shows the numbers of RBPs with canonical RNA binding domains, putative DNA/RNA binding domains and domains with various other functions. The bar chart shows the top 20 RNA Binding Domains represented in the RBPs.
(E) Summary of IP-WB results of eCLIP experiments done to date. Bar chart in the top panel summarizes the total number of antibodies that had either passed or failed the QC step in K562 and HepG2 cells individually. Punnett square at the bottom panel describes the QC results of 53 overlapping eCLIP experiments between K562 and HepG2 cell types.
See also Figure S1, Figure S2, Table S1, Table S2 and Table S4.

