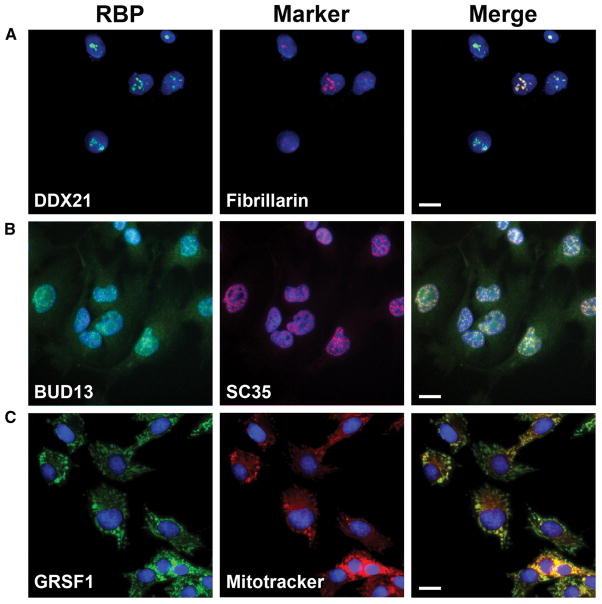
Figure 5. Immunofluorescence characterization of antibodies.
(A–C) Representative images of immunofluorescence characterizations of antibodies. Left column is the images of RBPs pseudo-colored in green, center column is the sub-cellular markers pseudo-colored in red and the right column is the merged image of RBP, subcellular marker and nuclear stain (blue). Scale bar in the merged image represents 20nm. (A) DDX21 antibody (RN090PW) co-stained with nucleolar marker fibrillarin. (B) BUD13 antibody (A303-320A) co-stained with nuclear speckles marker SC35 and (C) GRSF1 antibody (RN050PW) co-stained with mitochondrial marker mitotracker. See also Table S6.

