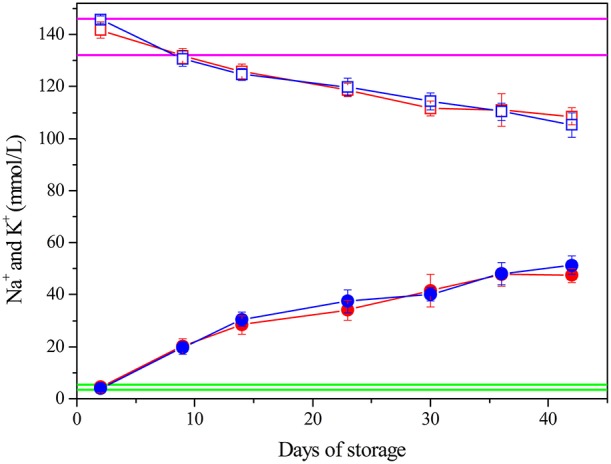
Figure 3.

Electrolytes concentration. K+: LPEC ( ), NLPEC (
 ). Na+: LPEC (
 ) NLPEC (
 ). Normal ranges are marked in green for K+, in magenta for Na+. ANOVA showed a significant effect of storage time (p < 0.0005) for both ions. Interaction between variables is not significant. Post hoc-tests between storage times of the same preparation were always significant (p < 0.05) both for LPEC and NLPEC.
