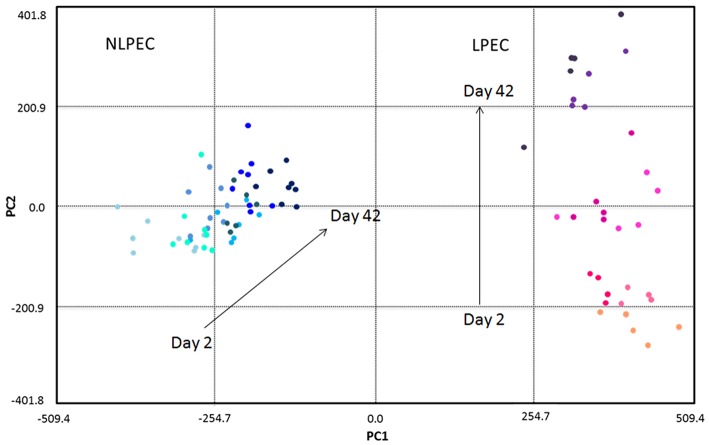
Figure 6.
Chemometric analysis of RBC lysates samples. The score plot reports NLPEC samples (light to dark blue symbols) and LPEC (orange to violet symbols). PC1 separates on the x axis the two preparations with the major contribution of glucose, lactate and alanine. Mannitol, ATP and GSH contribute to PC2, that on the y axis separate each preparations by day of storage.

