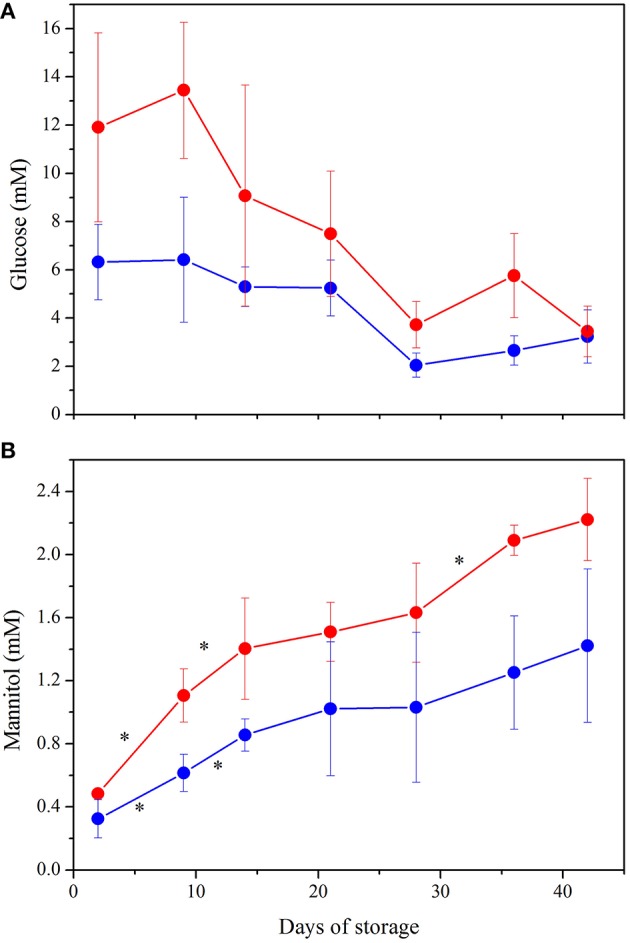
Figure 7.

NMR quantification of the major contributors to PCA plot: (A) Glucose. ANOVA indicated significant interaction between storage time and preparation (p < 0.001) as well as a significant effect of both variables alone (p < 0.0005). Post hoc tests showed higher concentration of glucose in LPEC from Day 2 to Day 36 (p < 0.05). (B) Mannitol. Storage time and preparation affect independently mannitol concentration (p < 0.0005 for both variables). *indicate p < 0.05 when comparing each storage time with the following one, in both preparations. Samples NLPEC ( ), LPEC (
 ).
).
