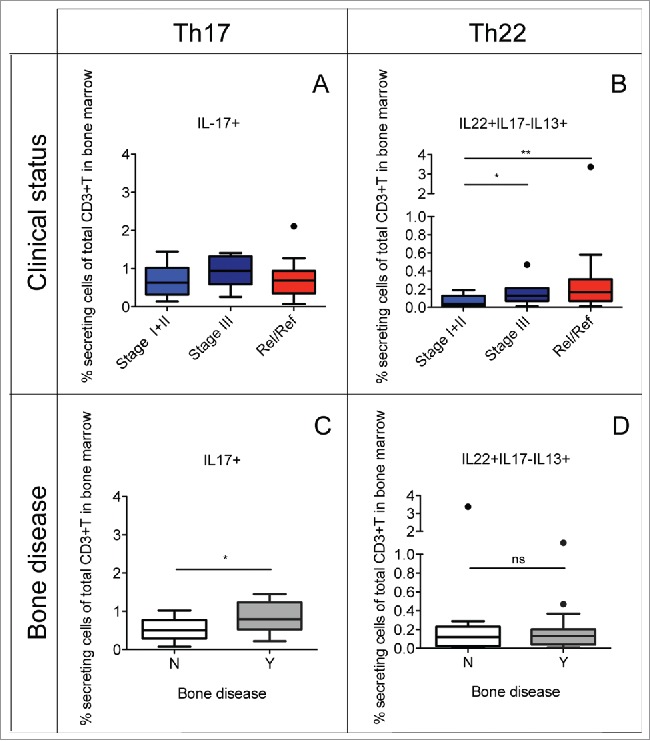
Figure 2.

Percentage of Th22 cells and Th17 cells in relation to the clinical status and the presence or the absence of bone disease. Tukey plots of cumulative results from intracellular staining analyses of IL-22, IL-17 and IL-13 expression by CD3+ T cells in BM aspirates. (A–B) Percentage of Th17 (i.e., IL-17+) cells (A) and Th22 (i.e., IL-22+IL-17−IL-13+) cells (B) in the BM of MM patients classified according to clinical status as: ISS Stage I+II (n = 12), Stage III (n = 7) and relapsed/refractory (Rel/Ref) (n = 14). (C–D) Percentage of Th17 (C) and Th22 (D) cells in the BM of MM patients grouped according to absence (N) (n = 11) or presence (Y) (n = 18) of bone disease. Responses significantly different by Mann Whitney U test are indicated as: *p < 0.05 and **0.001 < p < 0.01; ns: not significant.
