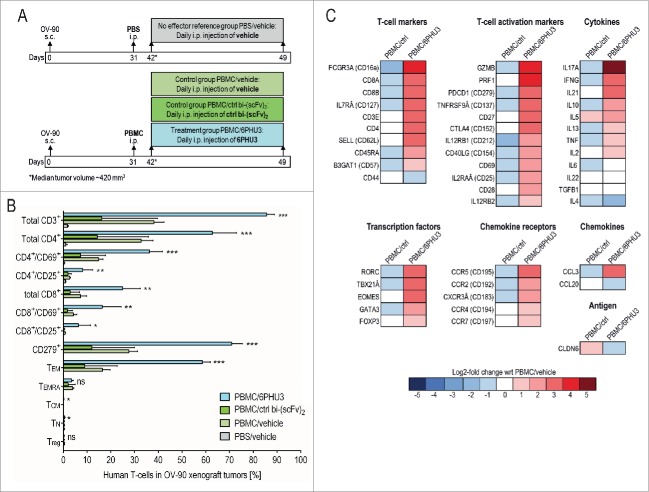
Figure 5.
T cells infiltrated into subcutaneous xenograft tumors in response to 6PHU3 have an activated and cytotoxic functional status. (A) Injection schedule scheme. (B) Flow cytometric analysis of human T cells in whole tumor tissue. Percentage of TILs from gated live singlet total cells is depicted. Significance was calculated by comparing PBMC/6PHU3 to PBMC/ctrl bi-(scFv)2 and to PBMC/vehicle. (C) Heatmap showing a log2-fold expression of PBMC/ctrl bi-(scFv)2 (‘PBMC/ctrl’) and PBMC/6PHU3 groups with respect to PBMC/vehicle group as reference (mean values of two independent runs). Gene expression was evaluated using a predesigned primer panel specific for 46 human T-cell identification-markers as measured by Fluidigm. Ns indicates not significant; TCM, central memory T cells; TEM, effector memory T cells; TEMRA, CD45RA+ effector memory T cells; TN, naive T cells; Treg, regulatory T cells; *p < 0.03; **p < 0.008; ***p < 0.0009.

