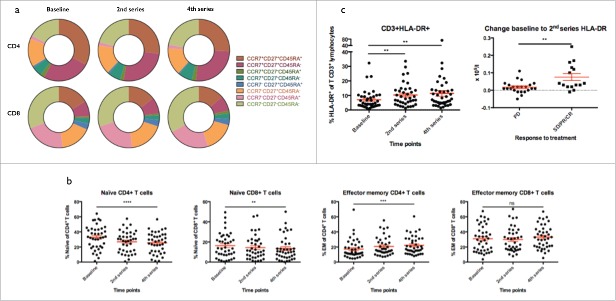
Figure 2.
T cell phenotype. a) Phenotype of CD4+ and CD8+ T cells according to expression of CCR7, CD27 and CD45RA. b) The proportion of naïve CCR7+CD27+CD45RA+ cells decreased in both CD4+ and CD8+ T cells during treatment (p < 0.0001 and p = 0.009 respectively. The proportion of effector memory CCR7-CD27-CD45RA- cells increased significantly in CD4+ T cells (p = 0.0001) and borderline significant in CD8+ T cells (p = 0.2). c) The proportion of HLA-DR+ T cells out of lymphocytes increased from baseline to 2nd and 4th series (both p = 0.002). The increase from baseline to 2nd series in the absolute number of HLA-DR+ T cells was significantly higher in responding patients (SD, PR and CR) as compared to non-responders (p = 0.003).

