
Figure 3.
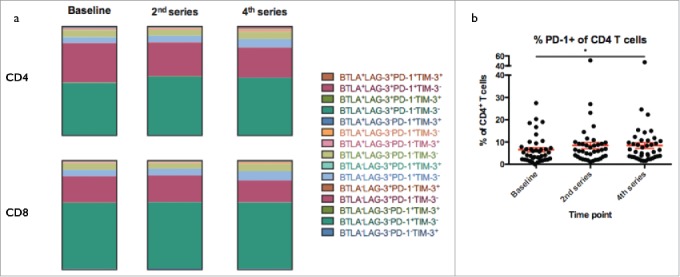
Exhaustion marker expression. a) Expression of combinations of the exhaustion markers PD-1, LAG-3, TIM-3 and BTLA in T cells and b) proportion of CD4+ T cells expressing surface bound PD-1. None of the individual subsets of T cells showed any change in frequency during therapy but a significant increase in the proportion of PD-1+ cells in CD4+ T cells was observed from baseline to 4th series (p = 0.03).