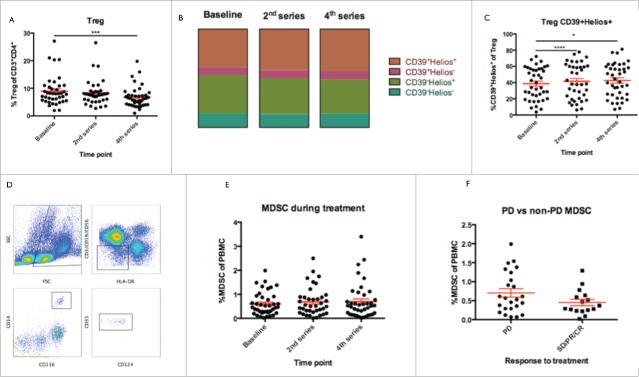
Figure 4.
Frequency of regulatory cells. a) Frequency of Tregs decreased during treatment from baseline to 2nd series and 4th series (p = 0.08 and 0.0001 respectively). b) Treg expression of transcription factor Helios and activation marker CD39. c) Tregs were enriched for cells expression both CD39 and Helios, suggesting an activated phenotype of naturally occurring regulatory cells (change from baseline to 2nd and 4th series, p = 0.0001 and 0.03 respectively. d) Gating strategy for MDSC, which were defined as Lin-HLA-DRlow/-CD14+CD11b+CD33+ (Lin defined as CD3, CD19 and CD56) out of PBMC. e) No changes in the frequency of MDSC were observed during treatment. f) A trend towards lower baseline frequency of PBMC were observed in patients attaining subsequent clinical response to treatment (SD, PR and CR) as compared to non-responding patients (p = 0.1).

