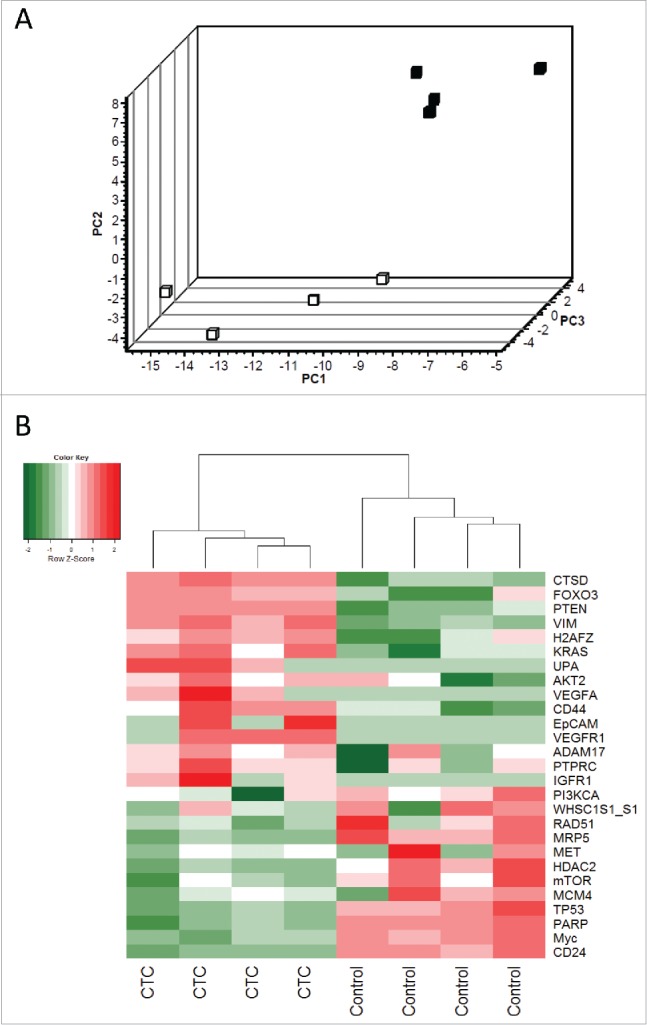
Figure 1.

Principle component analysis and hierarchical clustering of relative gene expression in CTC-enriched samples. (A) Principal component analysis represents the differential gene expression pattern of CTC-enriched samples (black squares, n = 4) and healthy controls (white squares, n = 4). Axis: X = PC1: PCA Component 1 (71.98% variance); Y = PC2: PCA Component 2 (93.35% variance) Z = PC3: PCA Component 3 (96.94% variance). (B) Heat map depicting the expression levels of mRNAs in the CTC-enriched samples (CTC, n = 4) compared with their expression levels in healthy controls (n = 4). The red and green squares indicate high and low mRNA levels, respectively.
