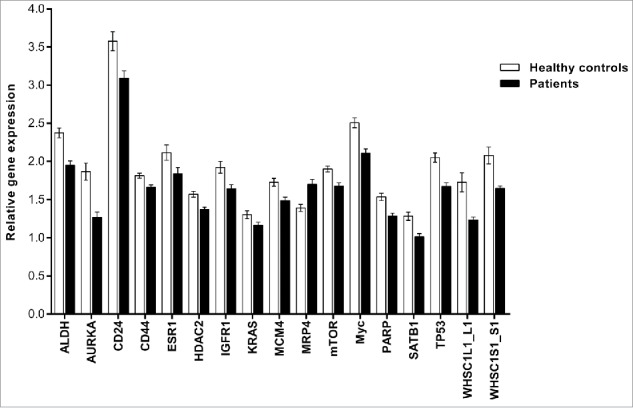
Figure 3.

Gene expression profiling of significantly differentially expressed genes in PBMCs. This figure shows genes that were significantly differentially expressed in breast cancer patients only. The PCR data were normalized to the selected reference genes and expressed on a log2 scale. All values are presented as the mean ± SEM. White bars, control group (n = 43); black bars, breast cancer patients (n = 147). The PCR data were analyzed by unpaired Student's t-test. Comparisons were considered significant at p ≤ 0.05.
