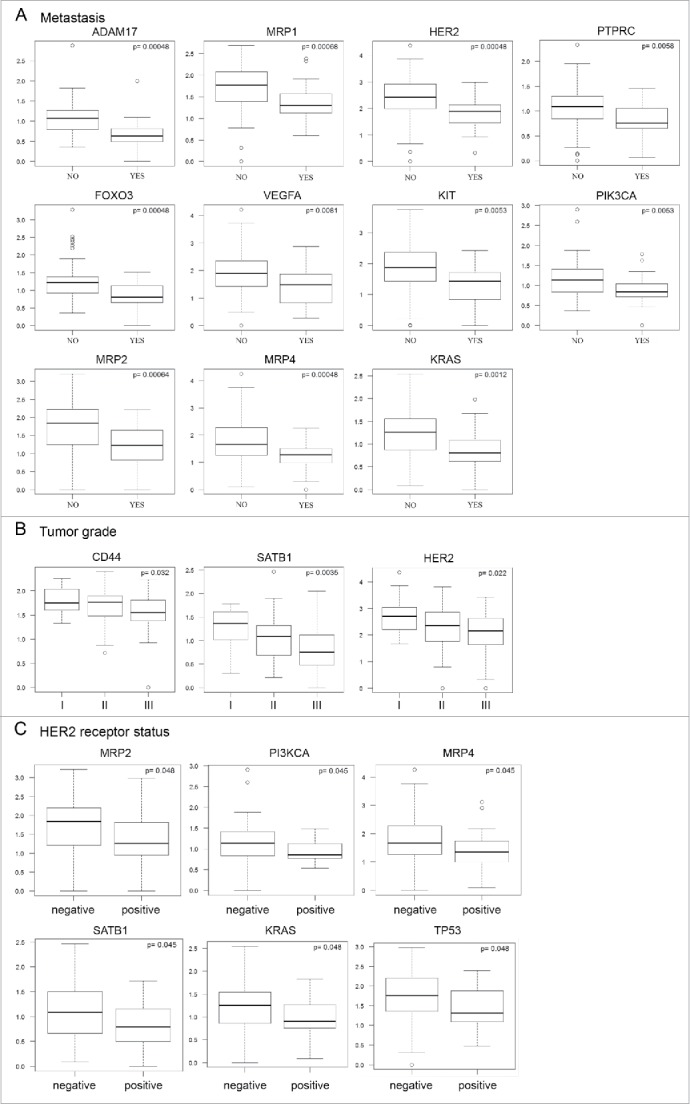
Figure 4.

Correlation analyses of gene expression profiles and clinical parameters of patients. Each plot represents correlation of particular gene expression with formation of metastasis (A), tumor grade (B), and HER2/neu receptor status (C). We observed that downregulated expression of selected genes in the PBMCs of breast cancer patients (n = 147) is significantly associated (p ≤ 0.05, p-values are controlled for false positives) with formation of metastasis (A), tumor grade (B), and HER2/neu receptor status (C).
