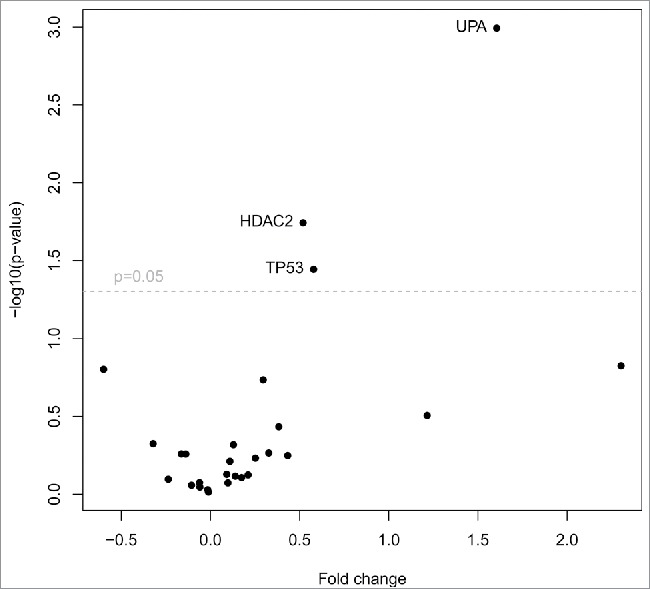
Figure 5.

TCGA data analysis of primary tumors and metastasis. Volcano plot filtering shows differentially expressed genes between primary tumors (n = 1,090) and metastasis (n = 7). Three genes (HDAC2, TP53, UPA), that are highlighted above the horizontal line (statistical significance boundary of p < 0.05) were significantly upregulated in primary tumors.
