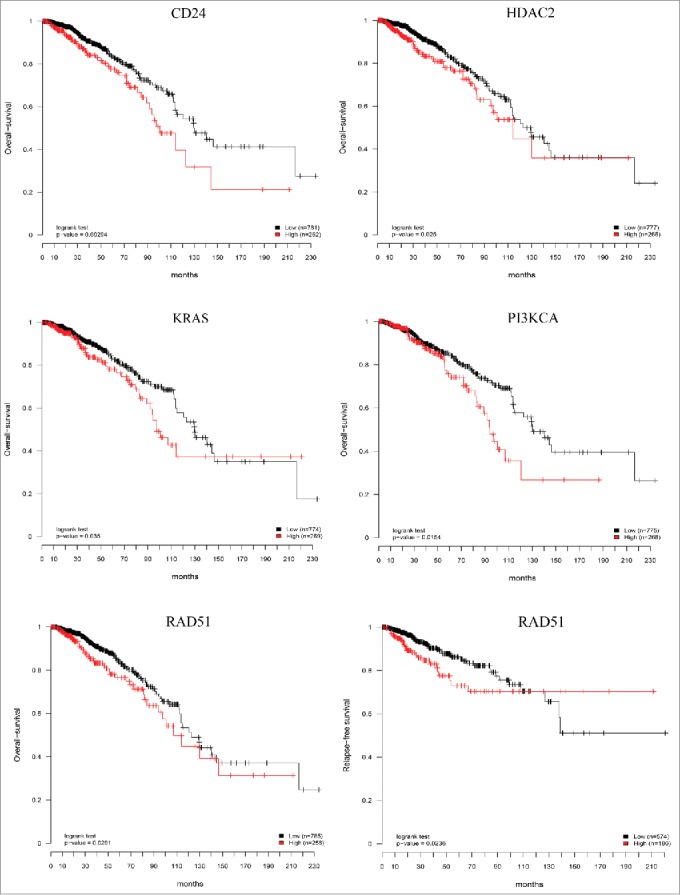
Figure 6.

Prognostic relevance of the CTCs gene signature. Six independent Kaplan–Meier curves show the comparison of overall-survival and relapse-free survival in independent cohort of breast cancer patients (TCGA data set) and confirmed that high expression of the genes studied is associated with poor patient's outcome. Red curves: high gene expression; black curves: low gene expression; p values from log-rank tests comparing the two KM curves are shown at the bottom of each plot.
