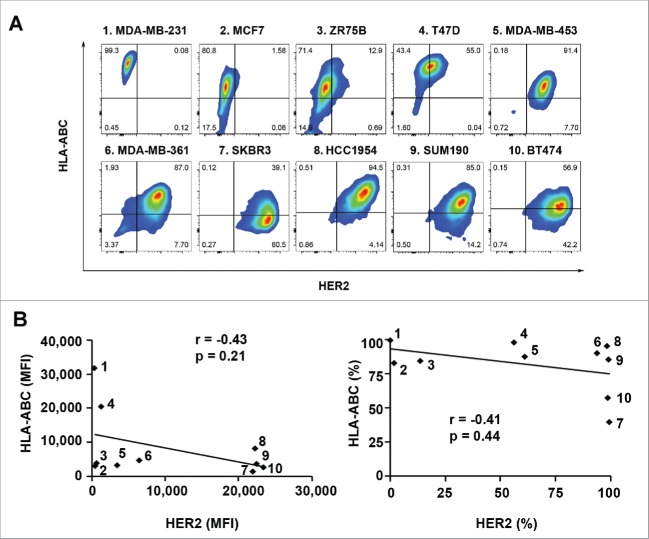
Figure 1.
Expression of HLA-ABC in a panel of human breast cancer cell lines with and without overexpression of HER2. The indicated breast cancer cells were double-stained with APC-conjugated anti-HLA-ABC antibody and trastuzumab plus FITC-conjugated anti-human IgG antibody and subjected to flow cytometry analysis. (A). Flow cytometric data on HLA-ABC expression versus HER2 expression in each cell line in contour plots. (B). MFI values of HLA-ABC expression vs. MFI values of HER2 expression (left) and percentages of HLA-ABC-positive cells versus percentages of HER2-overexpressing cells (right) in scatter plots. Pearson correlation coefficients (r) and p values are shown. The numbers next to the dots in the scatter plots correspond to the numbers next to the names of breast cancer cell lines in A.

