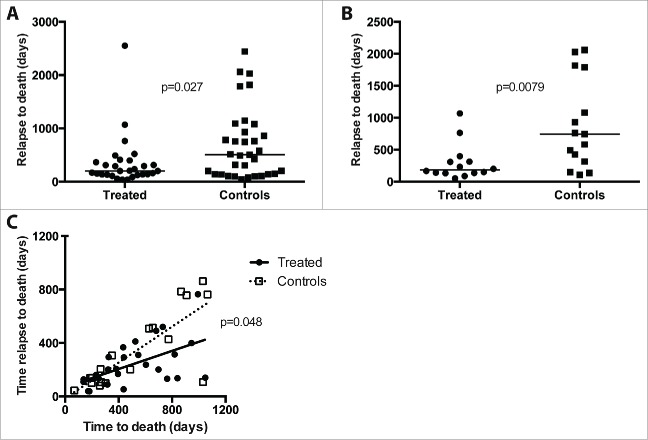
Figure 2.
Rate of disease progression in treated patients and controls as reflected by time between relapse and death. Panel A shows time between relapse and death in control patients (filled squares; n = 33) and IFN-α-treated patients (filled circles; n = 29). Panel B shows the corresponding results in a landmark analysis (controls, filled squares, n = 15; treated, filled circles, n = 14) excluding patients with relapse dates before day 225 of the study, corresponding to the end of the treatment schedule. Panel C shows time between relapse and death vs. time to death for controls (open squares, dotted line) and treated patients (filled circles, solid line). The slopes of the regression lines were significantly different (p = 0.048).

