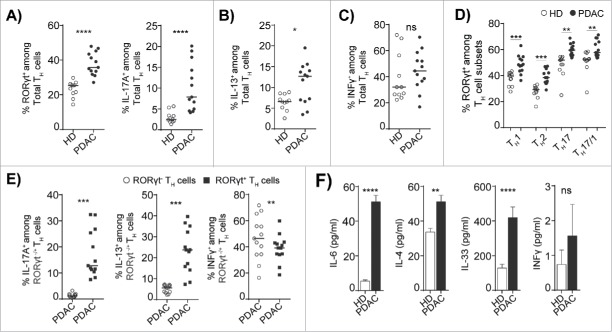
Figure 4.
A subset of RORγt+TH cells displays features of both TH2 and TH17 lineages. (A) Compiled frequencies of RORγt+ (left panel) IL-17A+ (right panel), (B) IL13+, and (C) INFγ+TH cells from HD and PDAC PBMCs. (D) Compiled frequency of RORγt expression in TH cell subsets from HD and PDAC PBMCs. (E) Compiled frequencies shows the IL-17A+, IL-13+, and INFγ+ RORγt− and RORγt+TH cells from PDAC PBMCs. HD (n = 11) and PDAC (n = 13). (F) Cytokines in HD and PDAC serum by ELISA HD (n = 10 to 11) and PDAC (n = 12 to 15). Error bars represents mean ± SEM, Horizontal bar represents median, each dot represents one patient. ns=non-significant, *p ≤ 0.05, **p ≤ 0.01, ***p ≤ 0.001, **** p ≤ 0.0001.

