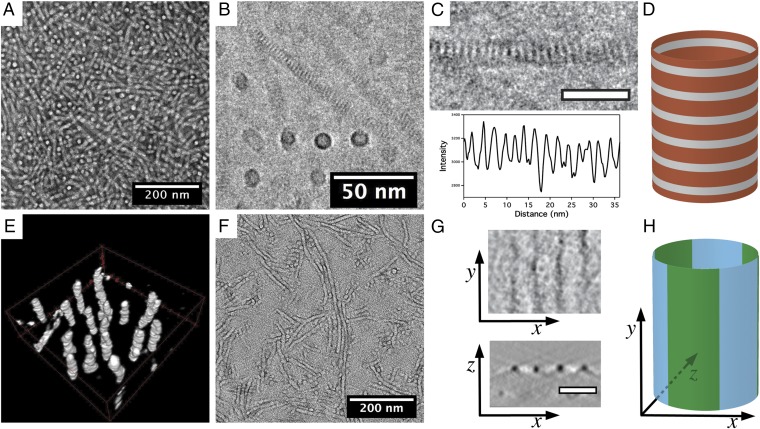
Fig. 3.
Electron microscopy analysis of pNdc18-b-pNte18 nanotubes. (A) Uranyl acetate negative-stained energy-filtered TEM micrograph of dried nanotubes. (B) Cryo-EM 2D projection image shows nanotubes of uniform diameter in a vitrified thin film. The dark stripe features likely result from the crystallized side chains. (C) Cryo-EM close-up of a single nanotube (scale bar, 20 nm) shows regular latitudinal stripes (Top). A line profile along the longitudinal direction of the nanotube indicates a periodicity of 2.4 ± 0.2 nm (Bottom). (D) Cartoon showing the origin of the latitudinal striping based on the backbone region (gray) and the side-chain regions (orange). (E) Three-dimensional visualized image of reconstructed nanotubes in a vitreous specimen. (F) Energy-filtered TEM micrograph of ruthenium tetroxide-stained dried nanotubes on continuous carbon. The dark region is assumed to be the pNte phase. (G) Slices in tomogram show both the top view and cross-section of ruthenium tetroxide-stained nanotubes, and indicate longitudinal black striping (pNte phase) with a periodicity of 11.1 ± 0.9 nm. The x, y, and z axes are indicated relative to the nanotube in H. (H) Cartoon showing the origin of the longitudinal striping based on the hydrophobic (green) and hydrophilic (blue) domains.

