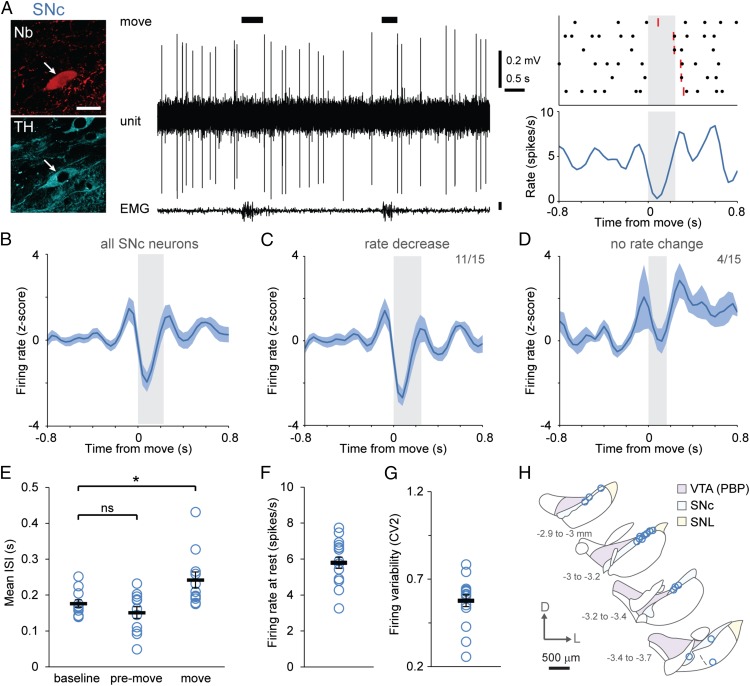
Fig. 1.
Dopaminergic SNc neurons exhibit a pause in firing during the onset of spontaneous movement. (A) Example of single-unit activity (Center) and a peri-event time histogram (PETH) (Lower Right) with the corresponding raster plot from an identified dopaminergic SNc neuron (Upper Right) during rest and spontaneous movement, the latter denoted by black bars, determined from video and EMG activity. The ends of individual movement epochs are denoted in rasters by red lines, and the mean duration of movement is indicated by gray shading. (Left) After recording, each neuron was juxtacellularly labeled with Neurobiotin (Nb) to identify its dopaminergic nature (by immunoreactivity to TH) and to confirm its location. (Scale bar, 20 μm.) (B–D) Mean normalized PETHs ± SEM. On average, SNc neurons (n = 15) transiently increased their activity just before movement and then paused their firing at the movement onset (B); 11 SNc neurons significantly decreased their rate during movement onset (C), and four did not change their rate significantly (D). (E) Mean interspike intervals (ISIs) during the baseline, premovement (ISIs ending in the 100 ms before movement), and movement (ISIs starting in the 100 ms preceding movement and ending after movement onset) periods. The ISI during movement onset was significantly longer than baseline ISIs [P < 0.01, n = 11 neurons that met analysis criteria (SI Materials and Methods), one-way repeated-measures ANOVA with Dunnett’s post hoc comparison]. (F and G) Firing rate (F) and variability quantified by CV2 (G) of all SNc neurons (n = 16) during alert rest. (H) Schematic coronal sections denoting locations within the SNc of all recorded and identified dopaminergic neurons. Adapted from ref. 50. The distance from bregma is shown on left. D, dorsal; L, lateral; PBP, parabrachial pigmented area of the VTA. Data are presented as mean ± SEM; *P < 0.05; ns, not significant.

