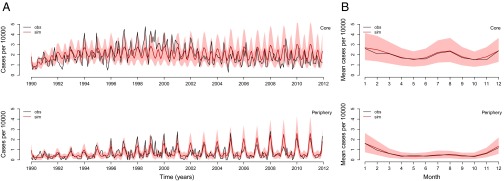
Fig. 3.
Comparison of simulated cases with those cases reported for the core and periphery of Dhaka. Time series (A) and seasonal pattern (B) for the observed cases (obs; black) and the mean of 1,000 model simulations (sim; red). The 10% and 90% percentiles of the simulated data are shaded in light red. The model simulations are not next step predictions, but numerical simulations of the model forward for the whole time period of the study starting with estimated initial conditions.

