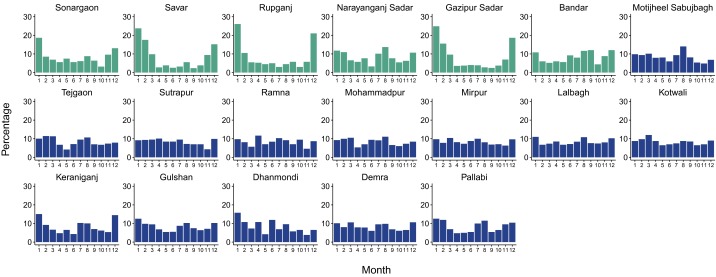
Fig. S1.
Percentage of reported cases per month for each thana. Each plot corresponds to a given thana. Thanas that are part of the core are depicted in dark blue, and thanas that belong to the periphery are depicted in cyan. Cases were first added for all years (1990–2011), and the percentage corresponding to each month was then computed. Thanas in the core exhibit a more endemic behavior with less pronounced troughs between seasons; thanas in the periphery typically show a higher peak in the winter and deeper troughs following this outbreak, with low levels of cases during the monsoons. Two thanas to the southeast of the city, Narayanganj Sadar and Bandar (map in Fig. S5) exhibit an intermediate pattern between the two average seasonalities described in the main text. Interestingly, population densities reach high values in a nonnegligible area of these thanas, especially for Narayanganj Sadar (Fig. S5).

