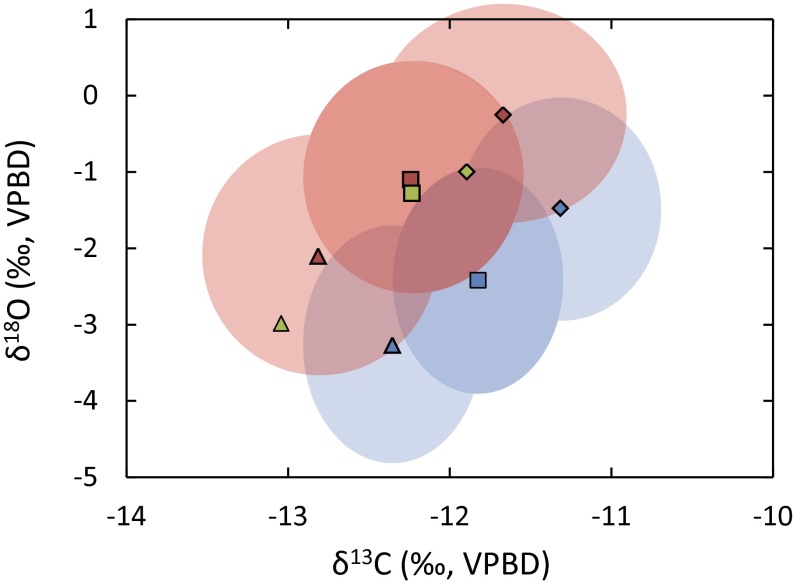
Fig. 2.
Bivariate plot of all gazelle carbon and oxygen isotope enamel molar data (Table 1). Blue symbols and shaded spheres (±1σ): EN HC; green symbols: LN HC; red symbols and shaded spheres (±1σ) LN HTC; squares represent mean values; triangles represent the average minimal values measured in each tooth; diamonds represent the average maximal value.

