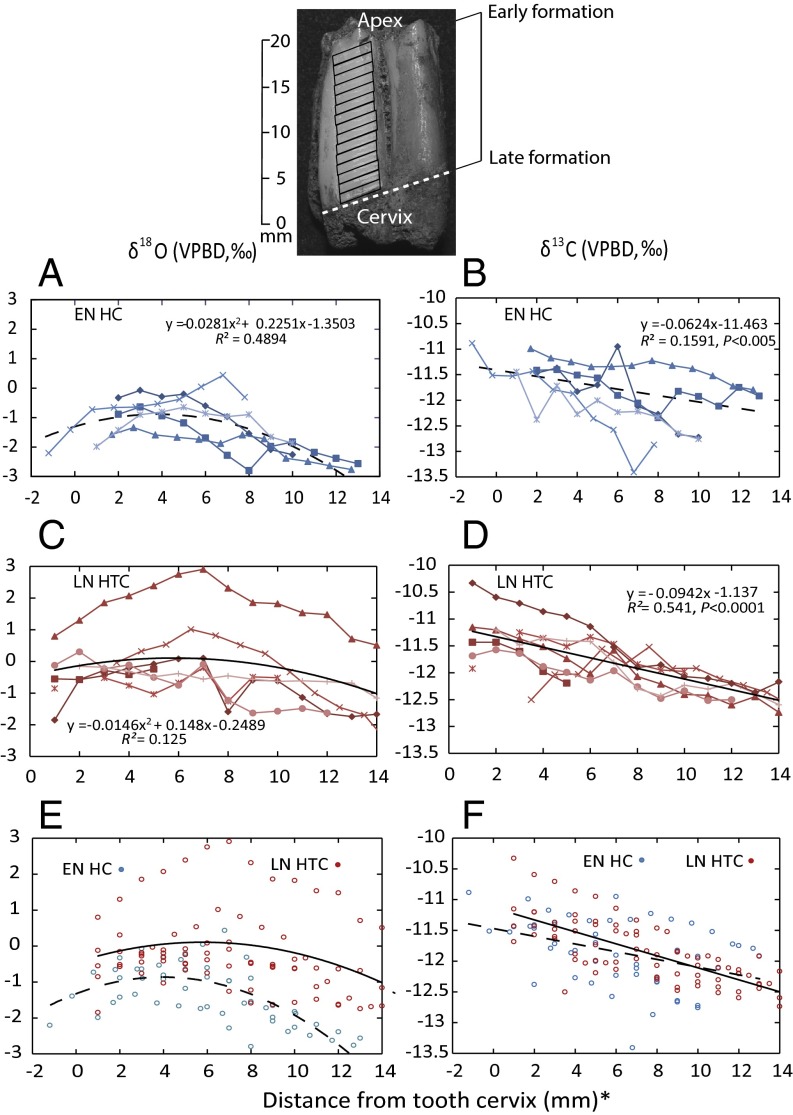
Fig. 3.
Sequential sampling results of individual M3 teeth from EN HC (blue-shaded plot lines) and Late LN HTC (red-shaded plot lines). The symbols in A (δ18O) correspond to those in B (δ13C) EN HC; and those from C (δ18O) correspond with D (δ13C) LN HTC; combined early and late Natufian sequential δ18O (E) and δ13C (F) data.

