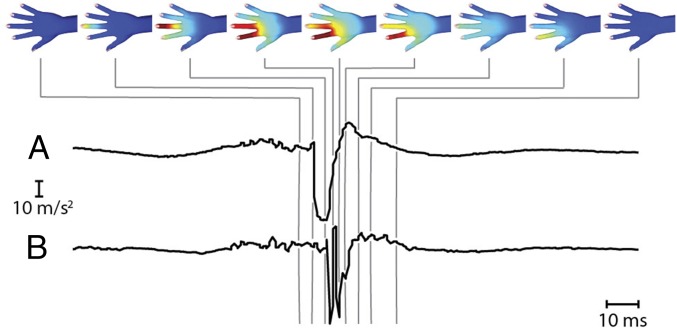
Fig. 4.
Spatiotemporal distribution of vibration intensity from a single recording when tapping digits I and II on a steel plate (configuration 30W). The time course of evolution of acceleration (y axis) at locations on the distal phalangeal area of digit III (A) and digit II (B) are shown (for further examples, see Fig. S1).

