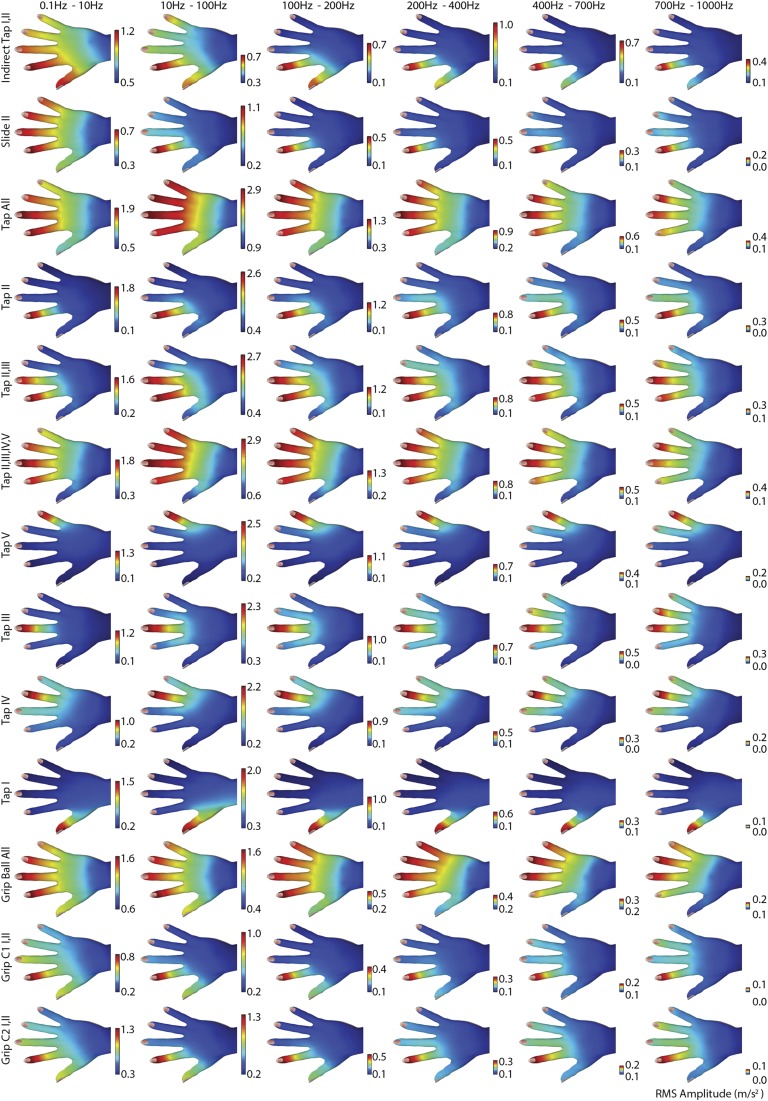
Fig. S4.
Examples of spatial patterns of vibration intensity in six nonoverlapping frequency bands for 13 classes of gestures. Color bars: RMS amplitude range. Vibration intensity decreased with increasing frequency in all conditions except indirect tap, which exhibited a secondary maximum in the band from 200 to 400 Hz. The lengths of the color bars represent the RMS acceleration range (m/s2) and the value at the top of the bars indicate the maximum value or the respective subplot. Each subplot was normalized over itself. The scales of color bars of all frequency band segments of the same gesture were normalized to facilitate comparison of relative vibration intensity between them.

