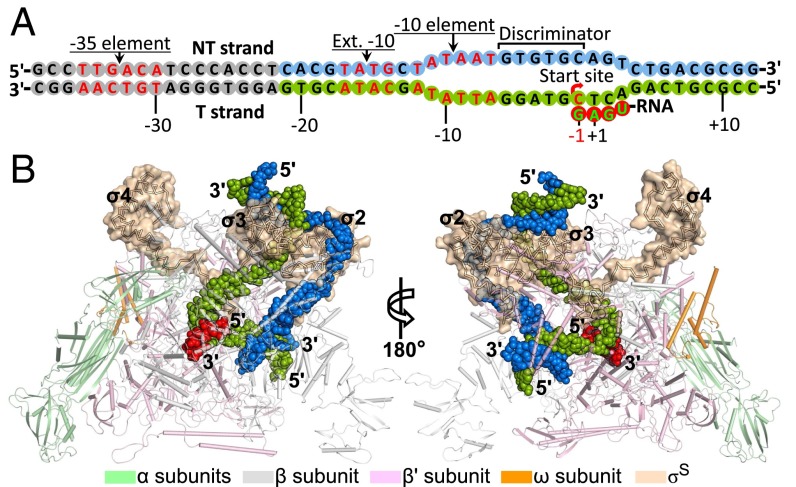
Fig. 1.
Overall structure of the E. coli σS-TIC. (A) Schematic representation of the synthetic promoter DNA and a de novo synthesized RNA transcript in the σS-TIC crystals. RNA synthesis starts from the −1 position with a GTP residue as observed previously with related promoters in the σ70-TICs (5). The disordered upstream DNA residues are shown as gray cycles. (B) Structure of the σS-TIC. The E. coli RNAP core enzyme is shown in a tube-and-arrow cartoon representation. The σS factor is shown as a Cα trace within a surface representation (wheat). The promoter DNA (NT strand, blue; T strand, green) and the nascent RNA (red) are shown as filled spheres.

