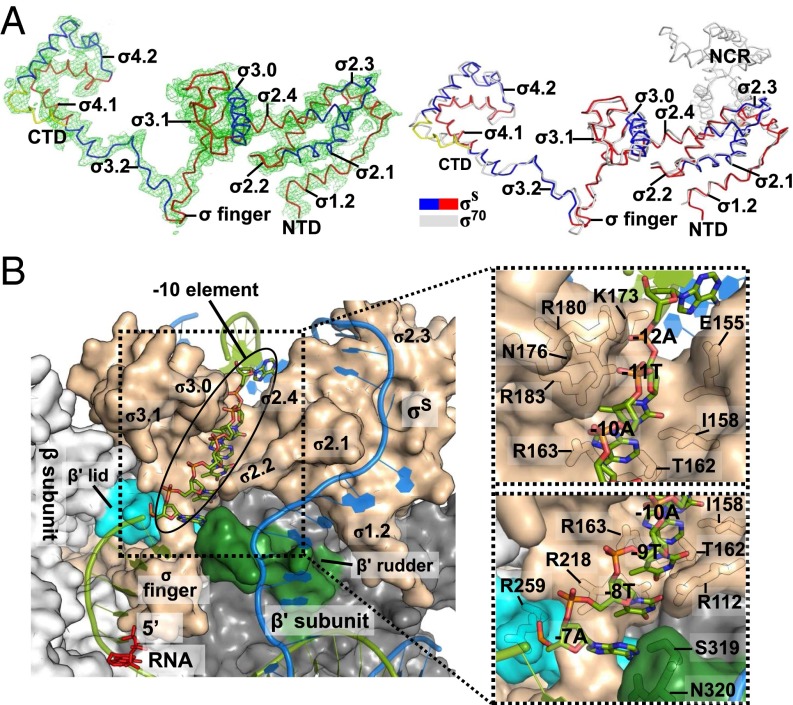
Fig. 2.
E. coli σS factor. (A) Overall structure of the E. coli σS factor in the σS-TIC. The orientation of σS here is the same as in Fig. 1. (Left) The Fo-Fc electron density map (mesh, contoured at 2.0 σ) was calculated using the phases from the RNAP core-only model. (Right) The E. coli σS factor in the σS-TIC (colored) and the σ70 factor in the σ70-holoenzyme (PDB ID code4JKR) (gray) are superimposed. (B) Recognition of the promoter −10 element in the σS-TIC. The N-terminal half of the β subunit (residues 2–667) is omitted for clarity. The nascent RNA (red) and the −10 hexamer residues of the T strand (green) are shown as sticks. The rest of the nucleic acid is shown in cartoon style (T strand, green; NT strand, marine). The RNA polymerase is shown in surface representation: σS, wheat; β subunit, light gray; β′ lid, cyan; β′ rudder, forest green; the rest of the β′ subunit is shown in dark gray. A few residues that interact directly with the −10 T-strand residues are labeled in the insets.

