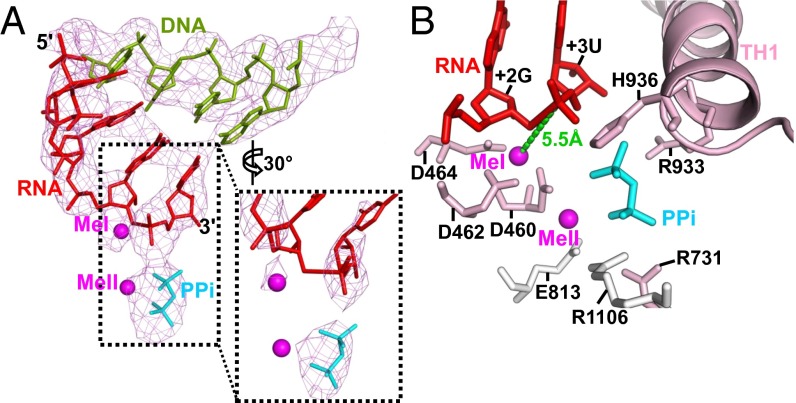
Fig. 3.
σS-TIC active site. (A) A close-up view of the DNA–RNA hybrid and PPi at the active site in the structure before NTP soaking. The Fo-Fc electron density map (mesh, contoured at 3 σ) was calculated using the phases calculated from the protein-only model. The inset shows a zoomed-in view of the electron density (contoured at 5 σ) around the catalytic site and the RNA 3′-terminal residue. (B) A close-up view of the active site showing the major interactions involved in stabilizing the PPi. The metal ions (MeI and MeII) are shown as magenta spheres.

