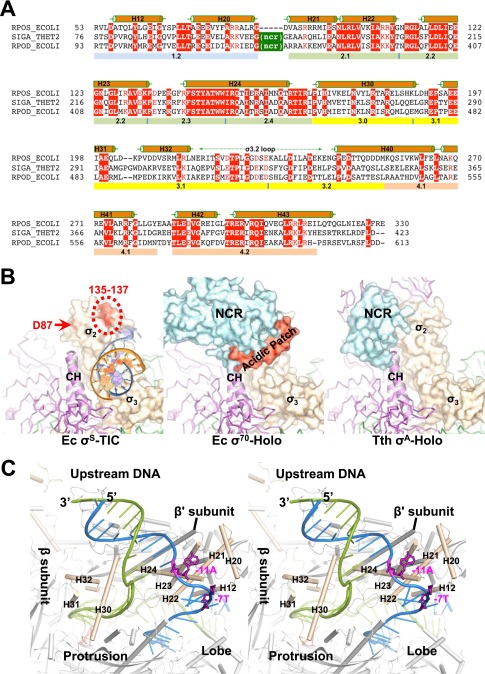
Fig. S2.
E. coli σS factor. (A) A sequence alignment of the E. coli σS factor (RPOS_ECOLI, GenBank accession no. gi:1710676) with the Thermus thermophilus σA factor (SIGA_THET2, gi:81699349) and the E. coli σ70 factor (RPOD_ECOLI, gi:1710680). Sequences are presented with the one-letter amino acid code; numbers at the beginning and end of each line indicate amino acid positions relative to the start of each protein sequence. Secondary structures (α helices) of the E. coli σS factor are indicated above the sequences, and evolutionarily conserved regions are labeled below the sequences. NCR marks the nonconserved region of the primary σ factors. (B) A comparison of the interactions of the σ2 domains of different σ factors with the RNAP core enzyme. Structures of the E. coli σS-TIC (Left), E. coli σ70-RNAP holoenzyme (Ec σ70-Holo, PDB ID code 4JKR) (Center), and the RNAP holoenzyme in the T. thermophilus initiation complex (Tth σA-Holo, PDB ID code 4G7H) (Right) are superimposed using the clamp helices (E. coli β′ residues 263–308; T. thermophilus β′ residues 538–583) and are shown separately in the same orientation. The σ factors are shown in surface representation; clamp helices are shown in ribbons; and the rest of the core enzymes are shown as Cα traces and are colored as in Fig. 1B. The σS residues D87, D135, P136, and E137 that interact with Crl are marked in red. The σ70 factor acidic patch (residues 188–209) is modeled and shown in red. A fragment of the upstream DNA in the σS-TIC (NT strand, blue; T strand, orange) that interacts with the σ2 and σ3 domains is shown for reference. (C) Stereoview of the upstream fork region of the σS-TIC. The promoter DNA is shown as ladders (NT strand, blue; T strand, green); the NT-strand residues −11A and −7T are shown as magenta sticks.

