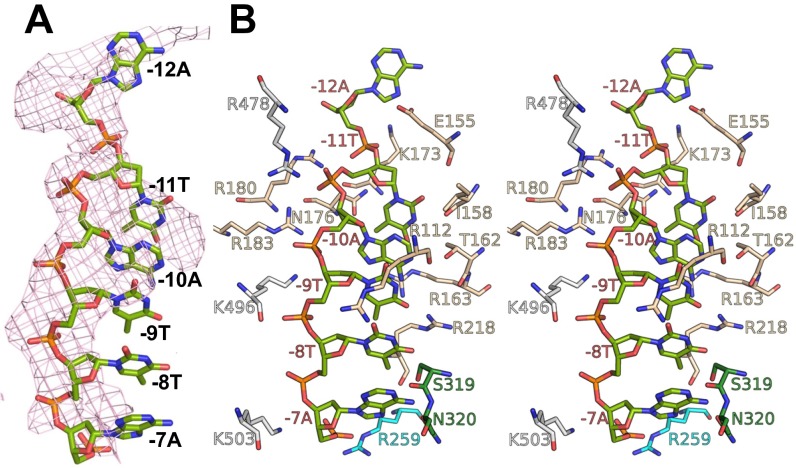
Fig. S3.
Local contacts at the −10 element of the T strand. (A) The pink Fo-Fc electron density map (mesh, contoured at 2.0 σ) was calculated using the phase from the protein-only model. (B) Stereoview of the local contacts at the −10 element of the T strand. Colors are as in Fig. 2. Most residues involved in the contacts, including R112, I158, R163, N176, R180, and R183, are conserved between σ70 and σS.

