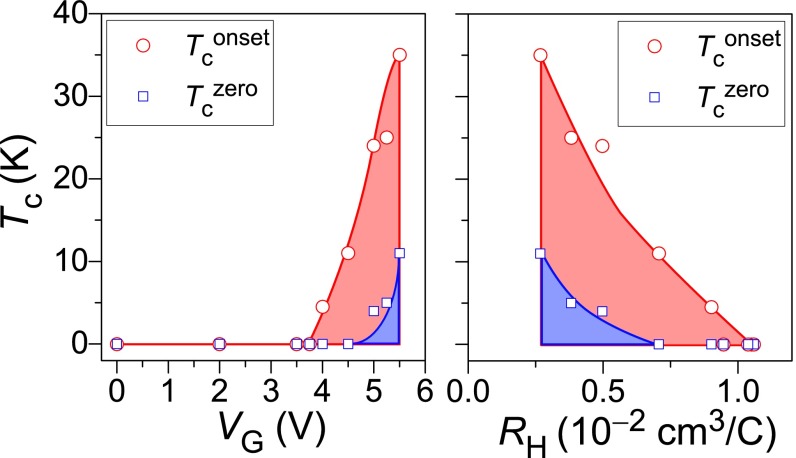
Fig. S7.
Electronic phase diagrams of the FeSe EDLT. (Left) Tc vs. VG and (Right) Tc vs. RH at 40 K. Circles and squares show onset Tc (Tconset) and zero resistivity temperature (Tczero), respectively. For a phase diagram (Tc vs. estimated sheet carrier density), see Fig. 4 in the main text.

