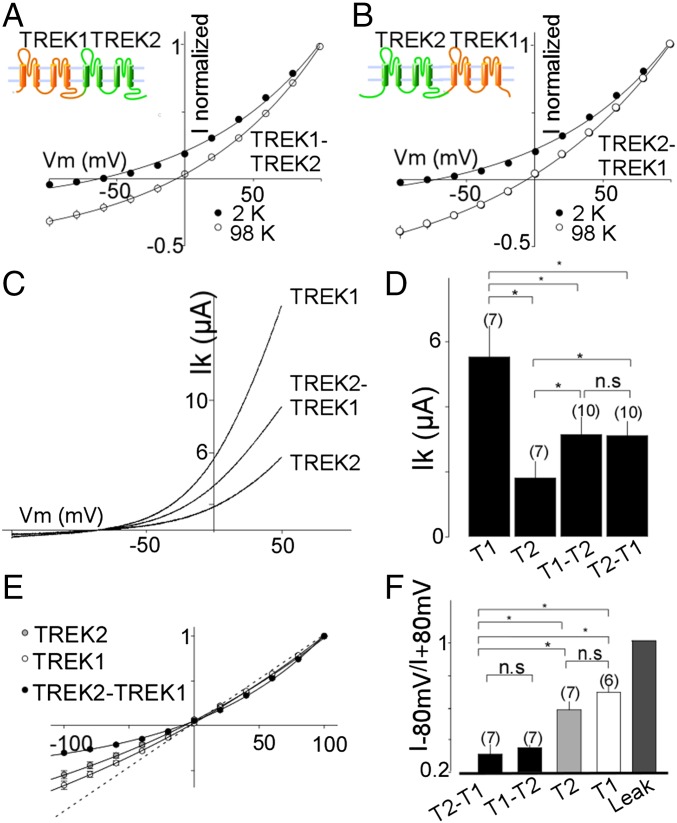
Fig. 3.
Functional characterization of TREK1-TREK2 heterodimers. Normalized current–voltage (I–V) curves for TREK1-TREK2 (T1-T2) (A) or TREK2-TREK1 (T2-T1) (B) tandem dimers in the presence of two concentrations of external potassium (2 mM and 98 mM). (C) Representative traces showing TREK1 (T1), TREK2 (T2), and TREK2-TREK1 currents elicited by voltage ramps (from −100 to 50 mV, 1-s duration). (D) Summary of average current amplitudes. (E) Normalized I–V curves for TREK1, TREK2, and TREK2-TREK1 obtained in symmetrical potassium conditions (98 mM). (F) Bar graph representing the ratio (absolute values) of mean current recorded at −80 and +80 mV. The numbers of cells tested are indicated in parentheses. Student’s t test (*P < 0.05). Ik, potassium current; n.s., not significant; Vm, membrane potential.

