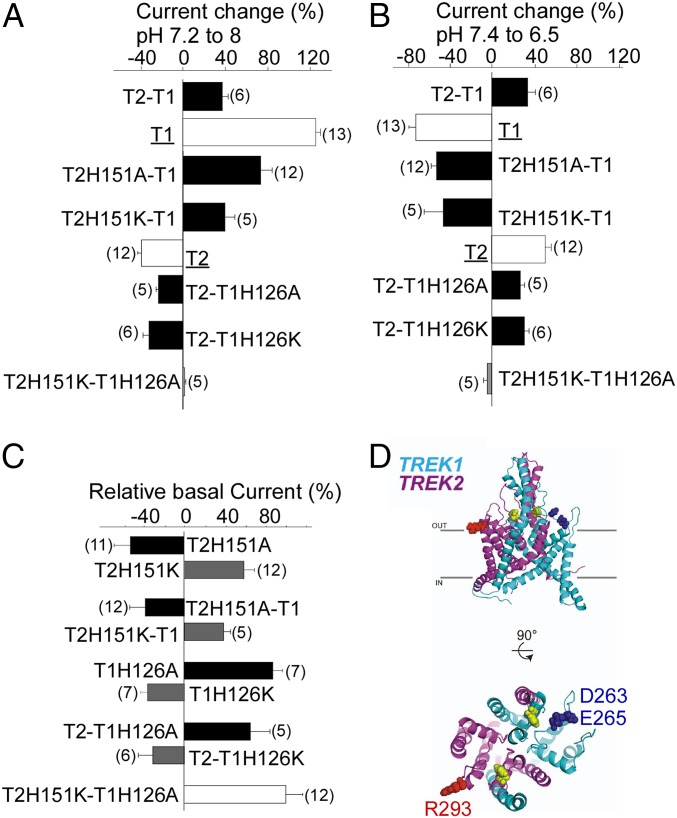
Fig. 6.
Mechanism of Pho sensitivity of TREK2-TREK1 heterodimers. (A) Bar graph showing the percentage of current at pH 8 relative to pH 7.2 for TREK1 (T1), TREK2 (T2), TREK2-TREK1 (T2-T1), and TREK2-TREK1 (T2-T1) mutants. (B) Bar graph showing the percentage of current at pH 7.4 relative to pH 6.5. (C) Bar graph showing the current amplitude of TREK2 (T2) mutants relative to TREK2, TREK1 (T1) mutants relative to TREK1, and TREK2-TREK1 (T2-T1) mutants relative to TREK2-TREK1. (D) Structural model of TREK1-TREK2 heterodimers showing His pH sensors (yellow). The proposed negatively charged interacting residues of TREK1 (cyan) are shown in blue, and the proposed positively charged interacting residues of TREK2 (magenta) are shown in red.

