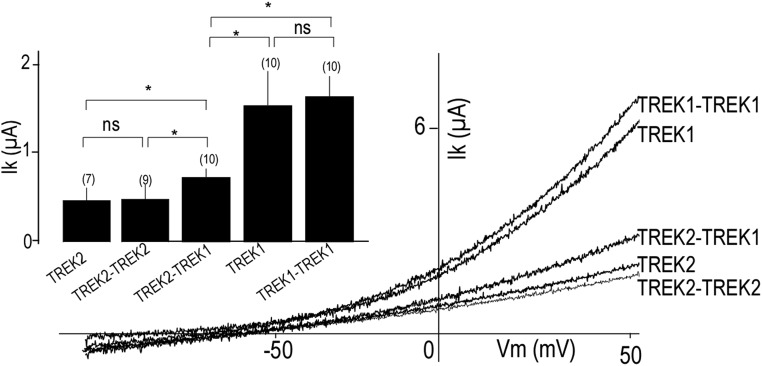
Fig. S3.
TREK1-TREK1 and TREK2-TREK2 tandem homodimers show the same amplitude as WT TREK1 and TREK2, respectively. Representative traces showing TREK1, TREK1-TREK1, TREK2, TREK2-TREK2, and TREK2-TREK1 currents. Currents were elicited by voltage-ramps (from −100 to 50 mV, 1 s in duration). (Inset) Bar graph showing average TREK1, TREK1-TREK1, TREK2, TREK2-TREK2, and TREK2-TREK1. The numbers of cells tested are indicated in parentheses. Student’s t test (*P < 0.05). Ik, potassium current; n.s., not significant; Vm, membrane potential.

