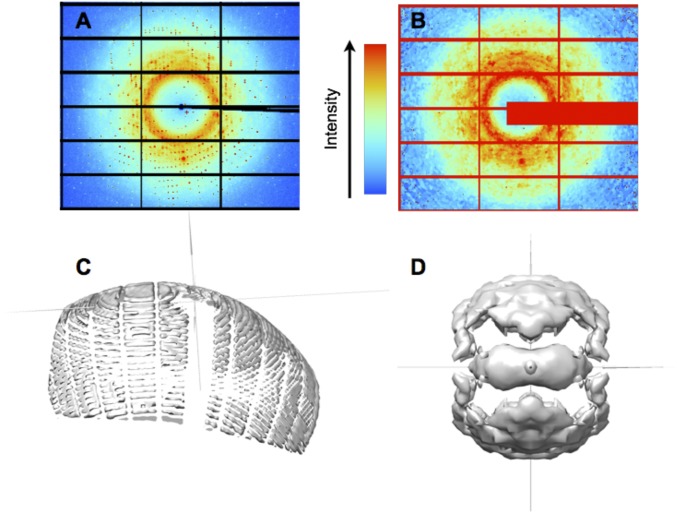
Fig. 1.
Steps in diffuse data integration. (A) Raw CypA diffraction images are processed (B) to remove Bragg peaks and enable direct comparisons of pixel values to models. (C) Pixels in diffraction images are mapped to reciprocal space and values of diffuse intensity are accumulated on a 3D lattice; each diffraction image produces measurements of diffuse intensity on the surface of an Ewald sphere. (D) The data from individual images are combined and symmetrized to yield a nearly complete dataset (isosurface at a value of 65 photon counts in the total intensity, before subtracting the isotropic component).

