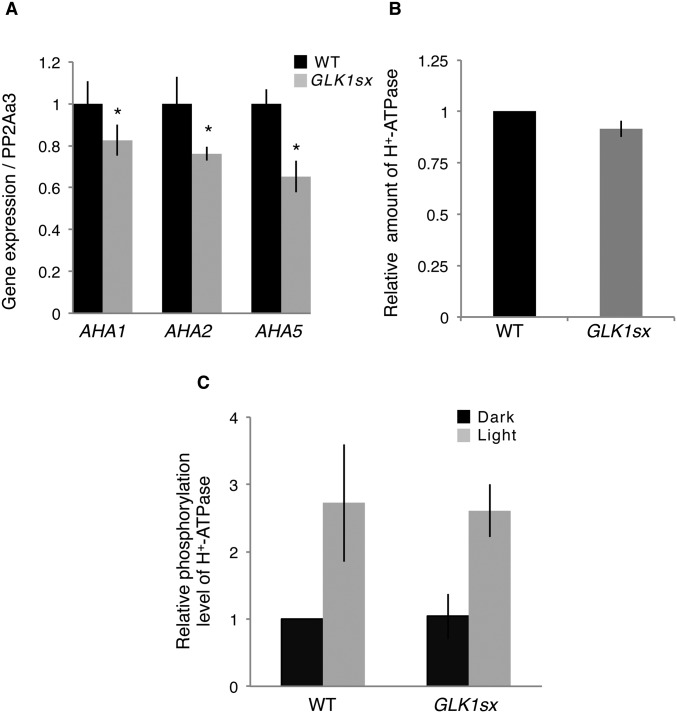
Fig. S5.
Gene expression and level of protein amount and phosphorylation of guard cell H+-ATPase. (A) Relative expression of AHA1, AHA2, and AHA5 by real-time RT-PCR, using RNA extracted from guard cell-enriched epidermis. The average of four replicates is shown. Error bars represent SD. *P < 0.05. (B) Relative amount of H+-ATPase by quantification of fluorescence images of stomata in the epidermis using anti–H+-ATPase. The average of three independent experiments is shown (n = 30). Error bars represent SD. (C) Relative phosphorylation level of H+-ATPase by quantification of fluorescence images of stomata in the epidermis using anti-pThr. The average of three independent experiments is shown (n = 30). Error bars represent SD.

