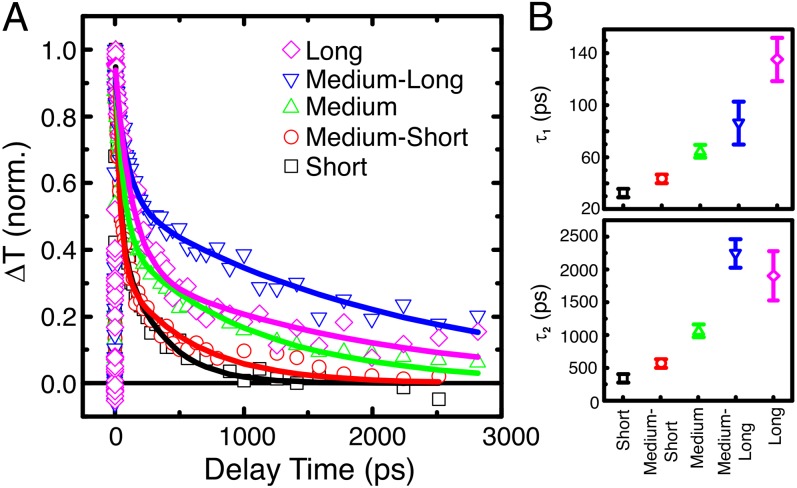
Fig. 5.
In situ TA spectroscopy experiments. (A) Normalized TA kinetic traces of Pt-decorated nanorods in ethanol. Lines show fits with a biexponential model. (B) Fitted time constants [τ1 (Top) and τ2 (Bottom)] for brookite nanorod samples with Pt. Films were pumped at 4.0 eV at a fluence of 220 µJ⋅cm−2. The broad absorption feature is integrated from 2.1 eV to 3.25 eV.

