Fig. 3.
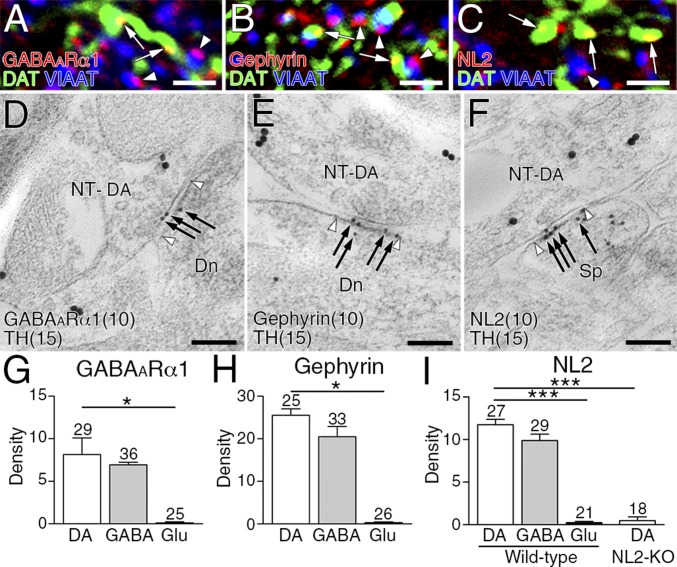
GABAergic postsynaptic phenotype at striatal dopamine synapses. (A–C) Triple immunofluorescence for DAT (green) and VIAAT (blue), and for GABAARα1 (A, red), gephyrin (B, red), or NL2 (C, red). Note close apposition of GABAARα1, gephyrin, and NL2 clusters to both VIAAT+ GABAergic terminals (arrowheads) and DAT+ dopaminergic terminals (arrows). (D–F) Double-label postembedding immunoelectron microscopy for TH [Ø (diameter) = 15 nm] and for GABAARα1 (D, Ø = 10-nm colloidal gold particles), gephyrin (E, Ø = 10 nm), or NL2 (F, Ø = 10 nm). Immunogold particles (arrows) are concentrated at symmetric synapses formed by TH-labeled dopaminergic terminals (NT-DA, arrowhead pairs). (G–I) The density of immunogold labeling for GABAARα1 (G), gephyrin (H), or NL2 (I) per 1 μm of synaptic membrane at dopamine (DA), GABAergic (GABA), and glutamatergic (Glu) synapses. The specificity of NL2 labeling is confirmed by almost blank labeling in NL2-KO mice (I). Representative images of GABAergic synapses are shown in Fig. S3. Numbers of synapses analyzed are indicated above each column. Error bars represent SEM. *P < 0.05 and ***P < 0.001 (unpaired t test). [Scale bars: 2 μm (A–C) and 100 nm (D–F).]

