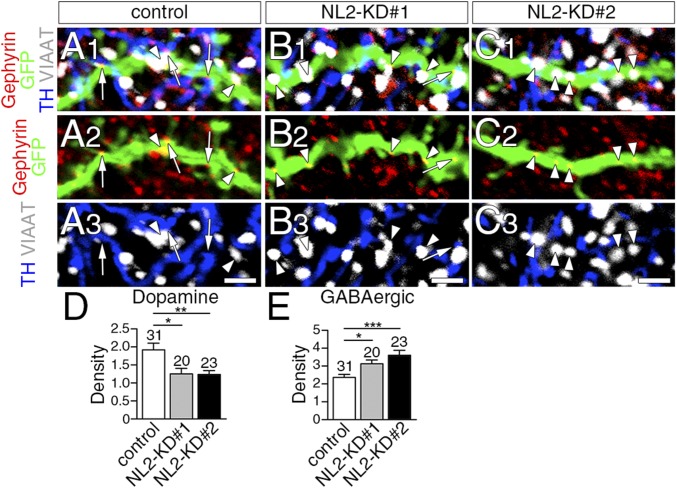
Fig. 6.
Decrease of dopamine synapses and reciprocal increase of GABAergic synapses after sparse NL2 knockdown in striatal MSNs. (A–C) Quadruple immunofluorescence for gephyrin (red), GFP (green), TH (blue), and VIAAT (gray) in spiny dendrites of control (A), NL2-KD#1 (B), or NL2-KD#2 (C) neurons. Arrows and arrowheads indicate dopamine and GABAergic synapses, respectively, on GFP-labeled dendrites. (D and E) The density of dopamine (D) and GABAergic (E) synapses per 10 µm of control and KD dendrites. The total number of dendrites analyzed is indicated above each column. Error bars represent SEM. *P < 0.05, **P < 0.01, and ***P < 0.001 (Mann–Whitney u test). (Scale bars, 2 μm.)

