Fig. S5.
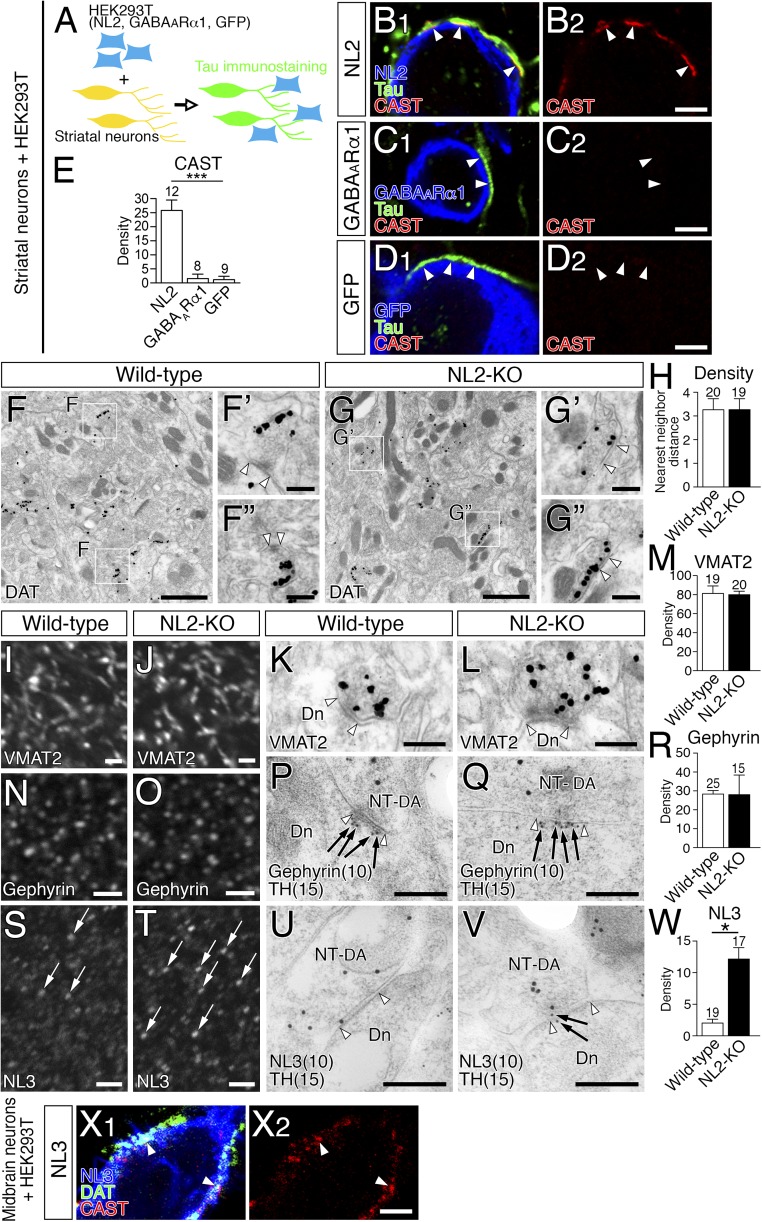
NL2-mediated presynaptic differentiation of GABAergic axons in vitro (A–E), unaffected dopamine synapse formation and compensatory NL3 up-regulation in the striatum of NL2-KO mice (F–W), and NL3-mediated presynaptic differentiation of dopaminergic axons in vitro (X). (A) A schematic illustration of coculture assay of striatal neurons with HEK293T cells transiently expressing NL2, GABAARα1, or GFP. Because striatal neurons are exclusively GABAergic, tau+ axons were discerned as GABAergic axons in this experiment. (B–D) Triple immunofluorescence for CAST (red) and DAT (green), and for NL2 (B, blue), GABAARα1 (C, blue) or GFP (D, blue). CAST clusters are recruited to contact sites (arrowheads) of striatal GABAergic axons with HEK293T cells expressing NL2 (B), but not GABAARα1 (C) or GFP (D). (E) The density of CAST clusters per 100 µm of striatal GABAergic axons in contact with HEK293T cells. The number of HEK293T cells contacted by tau-labeled striatal GABAergic axons analyzed is indicated above each column. ***P < 0.001 (one-way ANOVA with Tukey's post hoc test). (F and G) Pre-embedding immunoelectron microscopy for DAT in wild-type (F) and NL2-KO (G) mice. DAT+ dopamine synapses in the boxed areas of F or G are enlarged in F′ and F′′ or G′ and G′′, respectively. Open arrowhead pairs indicate symmetric contacts at DAT+ dopamine synapses. (H) Nearest-neighbor distances (µm) between dopamine synapses in wild-type (open column) and NL2-KO (filled column) mice. (I–W) Immunofluorescence and immunogold labeling for VMAT2 (I–M), gephyrin (N–R), and NL3 (S–W) in the striatum of wild-type (I, K, N, P, S, and U) and NL2-KO (J, L, O, Q, T, and V) mice. Pre-embedding immunoelectron microscopy was applied for VMAT2 (K and L), whereas double-label postembedding immunoelectron microscopy was used for TH [Ø (diameter) = 15-nm colloidal gold particles; P, Q, U, and V] and gephyrin (Ø = 10 nm; P and Q) or NL3 (Ø = 10 nm; U and V). Bar graphs show the densities (mean ± SEM; n = 3 mice for each) of VMAT2 labeling (M) per 1 µm2 of dopaminergic terminals and of gephyrin (R) or NL3 (W) labeling per 1 µm of dopamine synapses in wild-type (open columns) and NL2-KO (filled columns) mice. Note that immunofluorescence intensity of NL3 in wild-type mice is low to moderate (S), whereas that in NL2-KO mice is elevated in some clusters (T, arrows). Open arrowhead pairs indicate symmetric contacts at dopamine synapses. Dn, dendrite; NT-DA, dopaminergic nerve terminal. The numbers of total synapses analyzed are indicated above each column (H, M, R, and W). *P < 0.05 (unpaired t test). Error bars represent SEM. (X) Triple immunofluorescence for CAST (red), DAT (green), and NL3 (blue) in cocultures of midbrain dopamine neurons with HEK293T cells expressing NL3. Note NL3 expressed in HEK293T cells induces CAST clustering at contact sites with DAT-labeled dopaminergic axons (arrowheads). [Scale bars: 2 µm (B–D, I, J, N, O, S, T, and X), 1 µm (F and G), 200 nm (F′, F′′, G′, and G′′), and 100 nm (K, L, P, Q, U, and V).]

