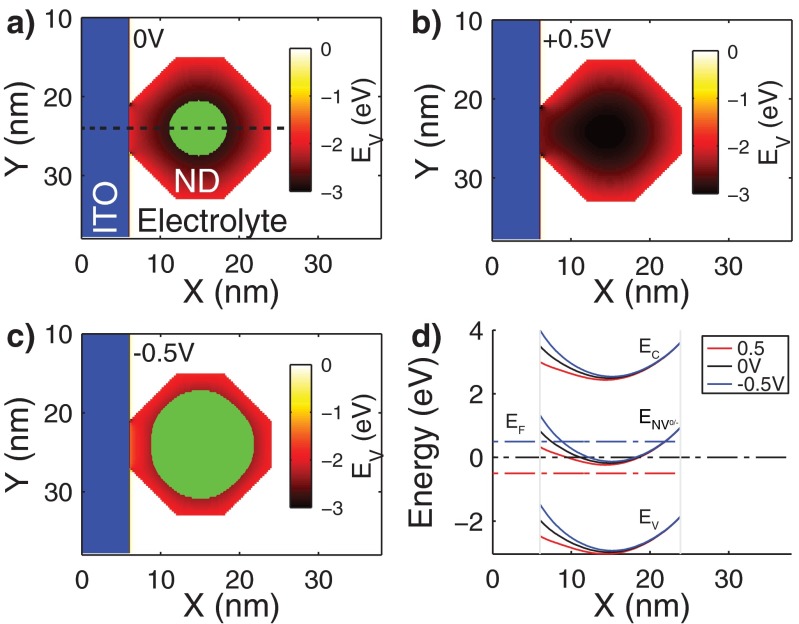
Fig. S1.
Numerical simulation result of the energy band diagram of the ITO/nanodiamond/electrolyte system. 2D map of the valence band maxima for (A) 0, (B) +0.5, and (C) −0.5 V. The regions for which ENV0/− < EF are highlighted in green. (D) Energy band diagram of the cross-section highlighted in A for the three applied potential differences.

